Thursday, December 17, 2009

Minimum mappable unit blues

I have a tendency to map in great detail...even when it is unwarranted or relates to a largely inconsequential stratigraphic situation. This problem is proportional to the quality of the base imagery that I have or the intrigue-level of the units in the field. However, in my quest to lead the effort to develop a surficial geologic map 10,000 sq. km. of dirt in Clark County in a compressed time frame, I am learning that it is ok not to sweat the details, as long as you explain what comprises the mapped units. One thing that we have learned is that it is essential to develop an agreed-upon minimum map unit area (mmu). That is, the smallest polygon that is mappable at the chosen scale.
As far as I can tell, geologists are not very keen on the mmu, whereas the dirt mappers in the NRCS have codified the concept in their considerably more standardized procedure.
We have adopted a visual approach that is based on the basic legibility of a polygon at a specific scale, and have concluded that 10 hectares is a good minimum value to start with. Ten hectares covers 100,000 square meters...or a square that is approximately 316 meters on a side. Sounds kinda big, looks quite big in the field, and certainly looks mappable at 1:24,000. However, if you zoom out to 1:100,000, the story changes.
The map below shows a random area in the county at 1:24,000. A selection of polygons is labeled with respect to size in hectares.
mmu24kwAnno.jpg

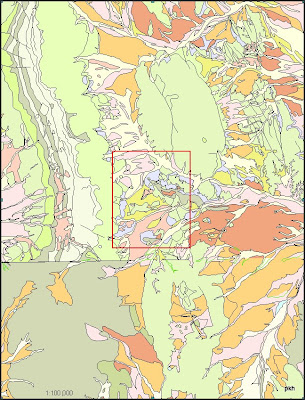
Sure, those all look totally mappable, right? Well, not so much. Check out the area when outlined in a 100k map:
mmu100k.jpg
(note: larger images viewable at:
http://geofroth.posterous.com/minimum-mappable-unit-blues)

Now the story is different. Not only are the small polygons bordering on illegible, the scale of the task of mapping such small polys consistently in a reasonable amount of time is impractical without a huge expenditure of time.
There are some side effects of eliminating units below a certain size threshold. One is data loss. That will be handled by preserving the small polys as points. Thus their locations will be stored as will their attributes. This solution can also facilitate the mapping process by flagging those polys that need to be absorbed into larger, surrounding or adjacent ones. One other problem is the case of high-standing inselbergs. Some of these are very tiny, but protrude several meters above the surrounding surficial deposits. Thus, their omission is particularly notable when in the field. For example, in the photo below, the fairly conspicuous cluster of red sandstone inselbergs has an areal extent of approximately 10 ha.

IMGP2448edt.jpg
Not mapping such a feature may seem like a total affront to the sensibility of a geologist, but there will be a point there in the dataset that indicates an awareness of the feature's existence.
More on this later.

Wednesday, October 28, 2009

Generalized Parent Material Map Progress


We recently generalized the existing bedrock geologic data for Clark County into 19 general lithologic categories. Our goal is to provide clear context for evaluating parent rock materials for the array of surficial deposits that we are compiling and mapping in more detail.

The units have been preliminarily divided into the following 19 categories (2 not yet used on the map):

Sedimentary Rocks (S)


Carbonates (Sc)
Limestone (Scl)
Dolomite (Scd)
Interbedded limestone and dolomite (Scld)

Siliciclastic sedimentary rocks (Ss)
Mudrock and shale (Sssh) (not yet used)
Chert and argillite (Ssc) (not yet used)
Sandstone and coarser (Ssss)
Interbedded shale and sandstone (Ssshss)


Interbedded carbonates and siliciclastic sedimentary rocks (Scs)


Igneous Rocks (I) Plutonic (p) Volcanic (v)

Felsic igneous

Intrusive (granite) (Ipf)
Extrusive (rhyolite and tuff) (Ivf)

Intermediate igneous
Intrusive (diorite) (Ipi)
Extrusive (andesite) (Ivi)

Mafic igneous
Intrusive (gabbro) (Imi)
Extrusive (basalt) (Ivi)

Mixed volcanic rocks (Ivx)

Metamorphic (M)

High grade (crystalline rocks) (Mh)
Low grade (phyllite, argillite, quartzite) (Ml)


It may be that this is more detail than is warranted...or maybe it is not quite enough...opinions will vary. The data are structured in such a way that ratcheting the detail up or down is not complicated. The goal is to work with the existing data in a consistent way across the study area.


Also, note that this project does not involve remapping any bedrock units other than where the boundaries with the Q deposits can be improved.

Tuesday, September 15, 2009

Correlating units from many maps

We reviewed the nomenclature for the existing maps that cover Clark County and correlated those units to the newly-developed Clark County nomenclature based on deposit type, what materials it is composed of, and any age constraints. In cases where the units do not correlate well, we simply added additional units to the Clark County nomenclature to accommodate the existing map’s nomenclature.

The following maps were compiled:
Las Vegas 100k: usgs sim 05-2814
Lake Mead 100k: usgs ofr 07-1010
Mesquite Lake 100k: usgs ofr 06-1035
Ludington, unpublished data
Death Valley ground-water model area, 250k: usgs mf 2381
Colorado, White River, and Death Valley groundwater flow systems, 250k: nbmg m150


This list of units with brief descriptions is the current Clark County nomenclature.

The following correlation diagrams are split by deposit type and show how all the compiled maps correlate to each other and to the new Clark County nomenclature.


Making one map from six: Fun with ArcGIS!

It took a great deal of experimentation to get the final data sets merged and ready to work with. Below are the steps we used to do this.

Downloaded original data.

Checked projection. Is it defined? If not, define it (define projection tool).

Several data sets were in UTM NAD 27. Our final map will be in UTM NAD 83. So, re-projected NAD 27 data sets to NAD 83 (project tool).

Where data extends beyond the county, we clipped it (clip tool). Where data sets overlap, we chose to keep the larger-scale data and clipped the smaller-scale data to it.

Imported the data sets into an sde, creating line and poly feature classes for each map.

Attributes: To each line feature class, we added attribute fields named CC_ltype, orig_OID, orig_ltype, and source. To each polygon feature class, we added attribute fields named CC_surf, CC_rox, orig_OID, orig_unit, and source. Orig_OID, orig_ltype, and orig_unit were populated from the original data as a way to preserve and refer to the original data. CC_surf was populated based on unit correlations. All attribute fields besides the ones listed above were deleted.

All of the line feature classes were then merged into one line feature class, and all polygon feature classes into one polygon feature class. The merge tool is pretty straight forward, but behaves in ways I can’t claim to fully understand. Even though all the data sets had the same attribute fields, the merge tool appears to be picky as to the order in which you add data sets that you want to merge. For example, I was unable to merge all of the data sets at one time. I had to merge smaller groups of data sets and then merge the merged groups. I’m not sure why, but it worked.

We are now ready to start adding our own lines and modifying the existing data if needed!

Monday, August 3, 2009

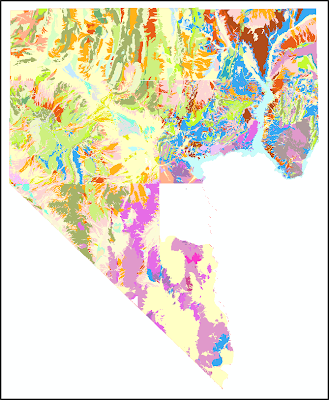
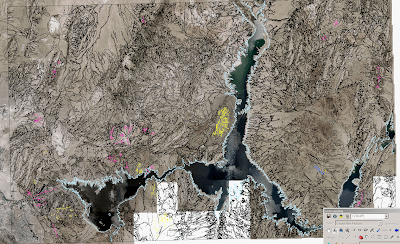
First glimpse of the unified surficial geologic map of Clark County


This map represents the results of our attempt to unify the surficial geology and geomorphology of Clark County as expressed in available digital data sources spanning most of the county. Much work remains to be done to fully unify the various sources, but this is a big step.

Soon we will develop a 'postable' figure showing our interpretations of the published data that were unified, thus explaining the colors on the map. In the example above, the bedrock is not shown (note that the dark green is vegetation indicated on the base map).

Saturday, August 1, 2009

Realizing Full Coverage of the County at 100-150 k


A recent increase in dirt mapper activityhas resulted in a collective dataset covering ~75% of the county. These data from USGS and NBMG sources are presently being unified into a single classification scheme based on common process, material, and geochronologic characteristics. We will soon post the unifying scheme for comments.

We also are pursuing a couple of leads that include mapping of the remaining part of the county. We currently have our hands on a hard copy of a generalized bedrock map of Southern Clark County that we know will suit our needs well.

Wednesday, July 8, 2009

Geochronology Catalog in Google Earth

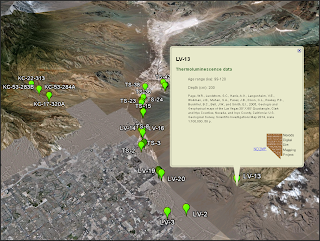
The Nevada Digital Dirt team has initiated a compilation of published geochronological data for Quaternary deposits in Clark County, NV. We are using the Google Spreadsheet Mapper tool to depict the data. Once we reach critical mass on the number of points from the available published sources, we will share the kml file and request suggestions for correcting any positioning or misattribution. So far, everything is under control with respect to the latter, but the former may need some work.

As you can see, it is a very intuitive way to depict and explore the data. Imagine if it were done for all the rock and dirt dates in the western US...

Saturday, July 4, 2009

Update: Sorry for the Hiatus! We are working.

Other projects have engulfed my time for the last several months, but significant 'background' progress has been made in developing a unified nomenclature for the surficial deposits of Clark County. We have been working up some diagrams and derivative maps from the existing data which we will post in the next couple of weeks. Sorry for the delay.

Thursday, February 19, 2009

Initial approach to evaluating available digital geo data

A previous post pointed out that some existing mapping of surficial deposits at 100k was inadequately detailed for the purposes of this project. We quickly made that assessment by draping the linework on imagery viewed in Google Earth and in ArcGIS. It is very likely that had the various geologists who developed this mapping over the years had such easy access to high-resolution imagery and GIS, then the mapping would be considerably less inadequate!


The example above shows the lines from the Lake Mead 100k map (USGS open-file data) in Google Earth. It works very well when zoomed into specific areas (down to 1:6000, for example), but the overall heterogeneity of the base imagery is a bit distracting. From this image (and the next) you can see that the detail in the bedrock is somewhat to considerably greater than that in the 'dirt'.

The image below is from ArcGIS and the lines from the Lake Mead 100k sheet are overlain on NAIP imagery. This imagery is also great when zoomed in and is homogeneous with respect to overall color balance, tone, etc. It is also from a much smaller window of time.


Our team has recently set up an image service at the UNR Geospatial Lab (Geography Dept.) that allows each investigator on the project to access the same high-resolution imagery remotely. Thus, we do not have multiple copies of giant .tiff files on all of our various computers. This is extremely helpful for collaboration and ensuring that everyone has equal access to the base imagery.

Friday, February 13, 2009

Surficial Geology Detail Comparison: Ivanpah Valley

There are two data sets of surficial geologic mapping that cover the Clark County part of Ivanpah Valley. The first one is from an NBMG map that I made. It is far too detailed to serve as a basis for mapping the entire county:


The same area from the 100k Mesquite Lake map shows considerably less detail, but relies on composite / combined units to account for this in most cases:


The Mesquite Lake snip above is from a map in which Ivanpah Valley is only a moderately small part. The map I developed (with help) was focused entirely on Ivanpah. As mentioned in a previous post, we are leaning toward some point between these two renditions. The NBMG map (published at 50k but mapped at ~12k) is excessively detailed and the USGS 100k map is a bit too general for what we would like to develop with the ND2MP. For example, we hope to map fewer composite units.

We suspect that we will ultimately end up closer to the USGS characterization of Ivanpah than to the NBMG characterization....not sure yet. We are actively applying generalization routines of various sorts to the NBMG data set. I will post a few examples next week.

An example of coarse detail on 100k map

As promised, and with no offense intended, here is an example of an area from an existing 100k geology dataset of Clark County that is clearly inadequately detailed from my perspective as a surficial mapper:
I made the contacts red to be obvious. Most of the tonal variations that you see in the image represent distinct surficial piedmont units. Many that have been lumped together are quite large and also span a huge range of time as far as surficial deposits go. Also it is not clear why some large active washes were mapped individually and other, larger ones weren't. This approach to mapping is covered in the unit descriptions from this map for the most part, but for our purposes, additional mapping is certainly required.

Digital Dirt Map Compilation Chronicles, Part 1 of MANY

To date, the ND2MP 'staff' has been compiling all of the existing, digital renditions of the geology of Clark County, Nevada. Luckily, the USGS has been compiling and developing 100k maps across the county and has, thus, done a fair amount of work for us already. What follows is a descriptive update of what we have been doing. Stay tuned for some graphic examples.

We have started to evaluate the relative worth of the various map data that we have in hand, and have gained some important insights.

First off, kudos to those authors who have pored over existing maps of a range of scales to develop their compilations (e.g., USGS versions of the Las Vegas 100k, Lake Mead 100k sheets). We are keenly aware of the huge amount of work that went into that process, and we are also aware that it involved new mapping in some areas. Even more kudos to those authors who generated large amounts of original mapping at similar scales (e.g. USGS version of the Mesquite Lake 100k). That was obviously a huge effort.

Given this, however, there are several facts about these maps that bear directly on our efforts. For example, there is a high degree of variability in the level of detail in the compilation maps. This fact is pointed out by the authors, so this comes as no shock to anyone. However, as we develop the surficial geologic map of the entire County, we are interested in developing a dataset that has a consistent level of detail across the entire area. This will be a large task. It will involve mainly enhancing the detail in existing compilations, but will also involve some generalization of overly detailed areas.

The latter point applies, for example, to the Ivanpah Valley area, where House et al., mapped in detail and Schmidt and McMackin mapped more generally. What we want for the ND2MP is somewhere in between those extremes, so we are experimenting with some automated generalization routines with the House et al. data and comparing the results to the Schmidt and McMackin mapping. I will post some examples when they are ready. Areas where the existing compilations are simply too general or appear somewhat arbitrary in detail will require significant amounts of new mapping as part of this project.

As for generalizing existing overly detailed maps, we are going to establish a minimum map unit criterion between 5 and 10 hectares. This refers to the areal extent below which we will not show a polygon. With respect to existing compilations, we plan to express polygons below the threshold as point-features in the database. We are also experimenting with ways to efficiently eliminate parts of polygons that are less than 30-50 meters wide. This issue arises mainly in the area of single-thread active washes. Ideally, we can collapse the narrow polys to centerlines that retain the atttribute when needed. This is sort of an 'annealing' function that digital cartographers are experimenting with, but we can't find any explicit add-in for doing it in ArcGIS except when it involves the distance between two polygons and not parts of the same polygon (doesn't create the line we want, however). When we progress in these areas, I will post examples to this blog.

Another arguably more important issue is that the existing compilations use different nomenclature for the surficial deposits. Given that several of these maps probably had overlapping compilation periods, are contiguous, and are from the same agency this is a bit surprising. However, I too have some pretty schizophrenic labeling schemes on my own maps and NBMG has no formal standard, so I can relate somewhat. In any case, for a county wide depiction of surficial geology that we want to ultimately apply statewide, it is absolutely necessary that we develop a consistent, flexible, and understandable framework. Each of the existing compilations provide some good and well-reasoned examples. We will begin with them and either choose the one we think is the best, or possibly confuse the issue more by developing a framework that we think is better. In any case, we will develop a rubric that explains how the various schemes relate. Currently, we are leaning toward a composite of the Las Vegas 100k approach with the Mesquite Lake 100k approach.

Stay tuned for an upcoming post that provides an opportunity to view and comment on our proposed scheme and its rationale. I will also prepare some examples of areas in need of generalization or more detailed mapping to support my statements above.

Tuesday, February 3, 2009

Ecosystem Indicators Project Research Objectives

ND2MP is supported in part by the Ecosystem Indicators (EIP), funded by the Clark County Multiple Species Habitat Conservation Program (MSHCP). The EIP has three main research objectives, ND2MP being a portion of one of those objectives. Objective one is to establish a robust GIS-based characterization of the geomorphology and surficial geology of Clark County, Nevada (i.e. ND2MP). Although the term ‘habitat’ is often used loosely as equivalent to ‘native vegetation’, this is not always the case. Nonetheless, scientist and managers continue to use vegetation as a means for defining habitat. Geologic materials provide an alternative and at times more appropriate means of defining species habitat and extent of vegetation communities, especially in arid environments (Miller and Franklin 2002, Heaton et al. 2006).

Objective two is to map the ecosystems in Clark County. The MSHCP uses an ecosystem-based approach to conservation planning and management for plant and animal species. We will update and refine the current vegetation based ecosystem model for Clark County. This includes the identification and spatial modeling of various NatureServe based Ecological Systems, Alliances and possible Associations. Our goal is to capture important ecosystems that include such broadly defined vegetation classes as blackbrush, sagebrush, pinion-juniper, saltbrush, creosote bush, Joshua Trees, etc. Additionally, we will for the first time develop spatial models for non-vegetation based MSHCP ecosystems such as dunes and dry lakes.

Objective three is to develop an enhanced vegetation based ecosystem classification model in three pilot areas using more intensive sampling, advanced spatial statistical methods and object-oriented classification and the newly developed geomorphology and surfical geology datasets. Current pilot areas under consideration include Piute-Eldorado Valleys, Ivanpah Valley, Gold-Butte and Kyle Canyon area across to the Sheep Range.